


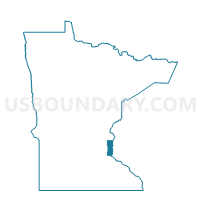
Census Tract 710.03, Washington County, Minnesota
About
Outline

Summary
| Unique Area Identifier | 467571 |
| Name | Census Tract 710.03 |
| County | Washington County |
| State | Minnesota |
| Area (square miles) | 3.88 |
| Land Area (square miles) | 3.63 |
| Water Area (square miles) | 0.25 |
| % of Land Area | 93.61 |
| % of Water Area | 6.39 |
| Latitude of the Internal Point | 44.87445810 |
| Longtitude of the Internal Point | -92.99869170 |
| Total Population | 3,435 |
| Total Housing Units | 1,466 |
| Total Households | 1,354 |
| Median Age | 37.3 |
Maps

Graphs
Select a template below for downloading or customizing gragh for Census Tract 710.03, Washington County, Minnesota


Neighbors
Neighoring Census Tract (by Name) Neighboring Census Tract on the Map
- Census Tract 374.03, Ramsey County, MN
- Census Tract 425.03, Ramsey County, MN
- Census Tract 603.01, Dakota County, MN
- Census Tract 604.02, Dakota County, MN
- Census Tract 605.02, Dakota County, MN
- Census Tract 710.12, Washington County, MN
- Census Tract 710.18, Washington County, MN
- Census Tract 712.06, Washington County, MN
- Census Tract 713, Washington County, MN
- Census Tract 9800, Ramsey County, MN
Top 10 Neighboring County Subdivision (by Population) Neighboring County Subdivision on the Map
- St. Paul city, Ramsey County, MN (285,068)
- Woodbury city, Washington County, MN (61,961)
- Maplewood city, Ramsey County, MN (38,018)
- Cottage Grove city, Washington County, MN (34,589)
- Inver Grove Heights city, Dakota County, MN (33,880)
- South St. Paul city, Dakota County, MN (20,160)
- St. Paul Park city, Washington County, MN (5,279)
- Newport city, Washington County, MN (3,435)
Top 10 Neighboring Place (by Population) Neighboring Place on the Map
- St. Paul city, MN (285,068)
- Woodbury city, MN (61,961)
- Maplewood city, MN (38,018)
- Cottage Grove city, MN (34,589)
- Inver Grove Heights city, MN (33,880)
- South St. Paul city, MN (20,160)
- St. Paul Park city, MN (5,279)
- Newport city, MN (3,435)
Top 10 Neighboring Unified School District (by Population) Neighboring Unified School District on the Map
- St. Paul Public School District, MN (285,068)
- South Washington County School District, MN (92,998)
- North St. Paul-Maplewood School District, MN (76,855)
- Inver Grove Heights Schools, MN (28,850)
- South St. Paul Public School District, MN (20,001)
Top 10 Neighboring State Legislative District Lower Chamber (by Population) Neighboring State Legislative District Lower Chamber on the Map
- State House District 56B, MN (49,803)
- State House District 39B, MN (40,778)
- State House District 57A, MN (40,488)
- State House District 55B, MN (38,632)
- State House District 67B, MN (35,739)
Top 10 Neighboring State Legislative District Upper Chamber (by Population) Neighboring State Legislative District Upper Chamber on the Map
- State Senate District 56, MN (91,226)
- State Senate District 57, MN (81,647)
- State Senate District 39, MN (77,255)
- State Senate District 55, MN (76,856)
- State Senate District 67, MN (72,594)
Top 10 Neighboring 111th Congressional District (by Population) Neighboring 111th Congressional District on the Map
- Congressional District 6, MN (759,478)
- Congressional District 2, MN (732,515)
- Congressional District 4, MN (614,624)
Top 10 Neighboring 5-Digit ZIP Code Tabulation Area (by Population) Neighboring 5-Digit ZIP Code Tabulation Area on the Map
- 55125, MN (43,281)
- 55119, MN (38,966)
- 55016, MN (34,204)
- 55076, MN (21,323)
- 55075, MN (20,152)
- 55129, MN (18,697)
- 55071, MN (5,569)
- 55055, MN (3,418)
Data
Demographic, Population, Households, and Housing Units
** Data sources from census 2010 **
Show Data on Map
Download Full List as CSV
Download Quick Sheet as CSV
| Subject | This Area | Washington County | Minnesota | National |
|---|---|---|---|---|
| POPULATION | ||||
| Total Population Map | 3,435 | 238,136 | 5,303,925 | 308,745,538 |
| POPULATION, HISPANIC OR LATINO ORIGIN | ||||
| Not Hispanic or Latino Map | 3,214 | 230,009 | 5,053,667 | 258,267,944 |
| Hispanic or Latino Map | 221 | 8,127 | 250,258 | 50,477,594 |
| POPULATION, RACE | ||||
| White alone Map | 2,920 | 209,012 | 4,524,062 | 223,553,265 |
| Black or African American alone Map | 173 | 8,579 | 274,412 | 38,929,319 |
| American Indian and Alaska Native alone Map | 25 | 1,088 | 60,916 | 2,932,248 |
| Asian alone Map | 132 | 12,071 | 214,234 | 14,674,252 |
| Native Hawaiian and Other Pacific Islander alone Map | 3 | 77 | 2,156 | 540,013 |
| Some Other Race alone Map | 91 | 2,300 | 103,000 | 19,107,368 |
| Two or More Races Map | 91 | 5,009 | 125,145 | 9,009,073 |
| POPULATION, SEX | ||||
| Male Map | 1,764 | 117,804 | 2,632,132 | 151,781,326 |
| Female Map | 1,671 | 120,332 | 2,671,793 | 156,964,212 |
| POPULATION, AGE (18 YEARS) | ||||
| 18 years and over Map | 2,596 | 174,538 | 4,019,862 | 234,564,071 |
| Under 18 years | 839 | 63,598 | 1,284,063 | 74,181,467 |
| POPULATION, AGE | ||||
| Under 5 years | 239 | 15,345 | 355,504 | 20,201,362 |
| 5 to 9 years | 233 | 17,867 | 355,536 | 20,348,657 |
| 10 to 14 years | 231 | 18,830 | 352,342 | 20,677,194 |
| 15 to 17 years | 136 | 11,556 | 220,681 | 12,954,254 |
| 18 and 19 years | 87 | 5,227 | 147,148 | 9,086,089 |
| 20 years | 35 | 2,131 | 72,732 | 4,519,129 |
| 21 years | 43 | 2,068 | 70,594 | 4,354,294 |
| 22 to 24 years | 121 | 7,621 | 212,325 | 12,712,576 |
| 25 to 29 years | 274 | 14,630 | 372,686 | 21,101,849 |
| 30 to 34 years | 222 | 14,234 | 342,900 | 19,962,099 |
| 35 to 39 years | 209 | 15,676 | 328,190 | 20,179,642 |
| 40 to 44 years | 238 | 18,567 | 352,904 | 20,890,964 |
| 45 to 49 years | 271 | 20,736 | 406,203 | 22,708,591 |
| 50 to 54 years | 306 | 19,676 | 401,695 | 22,298,125 |
| 55 to 59 years | 222 | 16,089 | 349,589 | 19,664,805 |
| 60 and 61 years | 84 | 5,571 | 120,761 | 7,113,727 |
| 62 to 64 years | 101 | 7,328 | 159,014 | 9,704,197 |
| 65 and 66 years | 55 | 3,709 | 86,158 | 5,319,902 |
| 67 to 69 years | 70 | 4,835 | 116,412 | 7,115,361 |
| 70 to 74 years | 91 | 5,896 | 151,857 | 9,278,166 |
| 75 to 79 years | 59 | 4,306 | 122,114 | 7,317,795 |
| 80 to 84 years | 59 | 3,159 | 99,916 | 5,743,327 |
| 85 years and over | 49 | 3,079 | 106,664 | 5,493,433 |
| MEDIAN AGE BY SEX | ||||
| Both sexes Map | 37.30 | 38.30 | 37.40 | 37.20 |
| Male Map | 36.10 | 37.20 | 36.30 | 35.80 |
| Female Map | 38.40 | 39.20 | 38.40 | 38.50 |
| HOUSEHOLDS | ||||
| Total Households Map | 1,354 | 87,859 | 2,087,227 | 116,716,292 |
| HOUSEHOLDS, HOUSEHOLD TYPE | ||||
| Family households: Map | 875 | 64,442 | 1,349,015 | 77,538,296 |
| Husband-wife family Map | 633 | 52,697 | 1,060,509 | 56,510,377 |
| Other family: Map | 242 | 11,745 | 288,506 | 21,027,919 |
| Male householder, no wife present Map | 95 | 3,512 | 89,707 | 5,777,570 |
| Female householder, no husband present Map | 147 | 8,233 | 198,799 | 15,250,349 |
| Nonfamily households: Map | 479 | 23,417 | 738,212 | 39,177,996 |
| Householder living alone Map | 382 | 18,666 | 584,008 | 31,204,909 |
| Householder not living alone Map | 97 | 4,751 | 154,204 | 7,973,087 |
| HOUSEHOLDS, HISPANIC OR LATINO ORIGIN OF HOUSEHOLDER | ||||
| Not Hispanic or Latino householder: Map | 1,302 | 85,997 | 2,027,489 | 103,254,926 |
| Hispanic or Latino householder: Map | 52 | 1,862 | 59,738 | 13,461,366 |
| HOUSEHOLDS, RACE OF HOUSEHOLDER | ||||
| Householder who is White alone | 1,233 | 81,033 | 1,870,205 | 89,754,352 |
| Householder who is Black or African American alone | 42 | 2,214 | 90,187 | 14,129,983 |
| Householder who is American Indian and Alaska Native alone | 11 | 277 | 19,078 | 939,707 |
| Householder who is Asian alone | 30 | 2,954 | 57,475 | 4,632,164 |
| Householder who is Native Hawaiian and Other Pacific Islander alone | 1 | 31 | 603 | 143,932 |
| Householder who is Some Other Race alone | 25 | 544 | 24,853 | 4,916,427 |
| Householder who is Two or More Races | 12 | 806 | 24,826 | 2,199,727 |
| HOUSEHOLDS, HOUSEHOLD TYPE BY HOUSEHOLD SIZE | ||||
| Family households: Map | 875 | 64,442 | 1,349,015 | 77,538,296 |
| 2-person household Map | 361 | 26,272 | 602,770 | 31,882,616 |
| 3-person household Map | 203 | 14,357 | 289,028 | 17,765,829 |
| 4-person household Map | 178 | 14,355 | 265,265 | 15,214,075 |
| 5-person household Map | 74 | 6,366 | 119,947 | 7,411,997 |
| 6-person household Map | 32 | 2,011 | 43,372 | 3,026,278 |
| 7-or-more-person household Map | 27 | 1,081 | 28,633 | 2,237,501 |
| Nonfamily households: Map | 479 | 23,417 | 738,212 | 39,177,996 |
| 1-person household Map | 382 | 18,666 | 584,008 | 31,204,909 |
| 2-person household Map | 78 | 4,065 | 121,616 | 6,360,012 |
| 3-person household Map | 12 | 468 | 18,766 | 992,156 |
| 4-person household Map | 3 | 162 | 9,356 | 411,171 |
| 5-person household Map | 3 | 42 | 3,055 | 126,634 |
| 6-person household Map | 1 | 8 | 886 | 48,421 |
| 7-or-more-person household Map | 0 | 6 | 525 | 34,693 |
| HOUSING UNITS | ||||
| Total Housing Units Map | 1,466 | 92,374 | 2,347,201 | 131,704,730 |
| HOUSING UNITS, OCCUPANCY STATUS | ||||
| Occupied Map | 1,354 | 87,859 | 2,087,227 | 116,716,292 |
| Vacant Map | 112 | 4,515 | 259,974 | 14,988,438 |
| HOUSING UNITS, OCCUPIED, TENURE | ||||
| Owned with a mortgage or a loan Map | 720 | 58,951 | 1,109,405 | 52,979,430 |
| Owned free and clear Map | 201 | 13,767 | 414,454 | 23,006,644 |
| Renter occupied Map | 433 | 15,141 | 563,368 | 40,730,218 |
| HOUSING UNITS, VACANT, VACANCY STATUS | ||||
| For rent Map | 72 | 1,106 | 48,091 | 4,137,567 |
| Rented, not occupied Map | 1 | 115 | 3,198 | 206,825 |
| For sale only Map | 12 | 1,061 | 30,726 | 1,896,796 |
| Sold, not occupied Map | 2 | 232 | 6,232 | 421,032 |
| For seasonal, recreational, or occasional use Map | 7 | 1,164 | 130,471 | 4,649,298 |
| For migrant workers Map | 0 | 13 | 334 | 24,161 |
| Other vacant Map | 18 | 824 | 40,922 | 3,652,759 |
| HOUSING UNITS, OCCUPIED, AVERAGE HOUSEHOLD SIZE BY TENURE | ||||
| Total: Map | 2.53 | 2.67 | 2.48 | 2.58 |
| Owner occupied Map | 2.68 | 2.76 | 2.59 | 2.65 |
| Renter occupied Map | 2.22 | 2.24 | 2.16 | 2.44 |
| HOUSING UNITS, OCCUPIED, TENURE BY RACE OF HOUSEHOLDER | ||||
| Owner occupied: Map | 921 | 72,718 | 1,523,859 | 75,986,074 |
| Householder who is White alone Map | 853 | 68,043 | 1,437,173 | 63,446,275 |
| Householder who is Black or African American alone Map | 23 | 1,246 | 22,968 | 6,261,464 |
| Householder who is American Indian and Alaska Native alone Map | 6 | 192 | 9,155 | 509,588 |
| Householder who is Asian alone Map | 20 | 2,319 | 32,562 | 2,688,861 |
| Householder who is Native Hawaiian and Other Pacific Islander alone Map | 1 | 24 | 308 | 61,911 |
| Householder who is Some Other Race alone Map | 11 | 375 | 9,816 | 1,975,817 |
| Householder who is Two or More Races Map | 7 | 519 | 11,877 | 1,042,158 |
| Renter occupied: Map | 433 | 15,141 | 563,368 | 40,730,218 |
| Householder who is White alone Map | 380 | 12,990 | 433,032 | 26,308,077 |
| Householder who is Black or African American alone Map | 19 | 968 | 67,219 | 7,868,519 |
| Householder who is American Indian and Alaska Native alone Map | 5 | 85 | 9,923 | 430,119 |
| Householder who is Asian alone Map | 10 | 635 | 24,913 | 1,943,303 |
| Householder who is Native Hawaiian and Other Pacific Islander alone Map | 0 | 7 | 295 | 82,021 |
| Householder who is Some Other Race alone Map | 14 | 169 | 15,037 | 2,940,610 |
| Householder who is Two or More Races Map | 5 | 287 | 12,949 | 1,157,569 |
| HOUSING UNITS, OCCUPIED, TENURE BY HISPANIC OR LATINO ORIGIN OF HOUSEHOLDER | ||||
| Owner occupied: Map | 921 | 72,718 | 1,523,859 | 75,986,074 |
| Not Hispanic or Latino householder Map | 898 | 71,435 | 1,497,368 | 69,617,625 |
| Hispanic or Latino householder Map | 23 | 1,283 | 26,491 | 6,368,449 |
| Renter occupied: Map | 433 | 15,141 | 563,368 | 40,730,218 |
| Not Hispanic or Latino householder Map | 404 | 14,562 | 530,121 | 33,637,301 |
| Hispanic or Latino householder Map | 29 | 579 | 33,247 | 7,092,917 |
| HOUSING UNITS, OCCUPIED, TENURE BY HOUSEHOLD SIZE | ||||
| Owner occupied: Map | 921 | 72,718 | 1,523,859 | 75,986,074 |
| 1-person household Map | 177 | 12,714 | 329,955 | 16,453,569 |
| 2-person household Map | 351 | 26,184 | 581,481 | 27,618,605 |
| 3-person household Map | 162 | 12,515 | 236,596 | 12,517,563 |
| 4-person household Map | 139 | 12,957 | 224,564 | 10,998,793 |
| 5-person household Map | 50 | 5,645 | 98,018 | 5,057,765 |
| 6-person household Map | 22 | 1,771 | 33,229 | 1,965,796 |
| 7-or-more-person household Map | 20 | 932 | 20,016 | 1,373,983 |
| Renter occupied: Map | 433 | 15,141 | 563,368 | 40,730,218 |
| 1-person household Map | 205 | 5,952 | 254,053 | 14,751,340 |
| 2-person household Map | 88 | 4,153 | 142,905 | 10,624,023 |
| 3-person household Map | 53 | 2,310 | 71,198 | 6,240,422 |
| 4-person household Map | 42 | 1,560 | 50,057 | 4,626,453 |
| 5-person household Map | 27 | 763 | 24,984 | 2,480,866 |
| 6-person household Map | 11 | 248 | 11,029 | 1,108,903 |
| 7-or-more-person household Map | 7 | 155 | 9,142 | 898,211 |
Loading...